
Community Services – Care Technology and Community Equipment
Last Updated: 01 June 2023
Where are we now
In Sutton we want to find the best and most effective ways to support people to live well independently and prevent the need for more intensive and long-term support. We see care technology and community equipment provision as playing a vital role in supporting people to achieve the best outcomes and address the challenges facing social care, health and housing provision.
Our Care Technology and Community Equipment Market
Sutton’s investment in technology enabled care is made up largely from the commissioned Telecare Referral to Response (TRR) service delivered by Careium and the Integrated Community Equipment Service delivered as part of a partnership arrangement with the London Borough of Croydon Equipment Service (CES). The partnership also comprises Merton Council.
The TRR model combines the key components of a 24/7 call monitoring centre with a community alarm service, technical assessments, equipment provision, installation, maintenance and 24/7 mobile response service.
A local team is based at the Careium retail shop located in Wallington. There are facilities for customers to test out devices and gadgets to help them remain living independently.
Sutton’s Telecare Referral to Response (TRR) service is provided to people in the following circumstances:
- As part of a care and support package following a Care Act assessment of need
- After a stay in hospital and or as part of their reablement
- Privately arranged by self funders
- As part of their housing support for grouped schemes. Remote monitoring is provided as housing related support and usually hardwired into buildings.
Local authorities have a statutory duty (under the Care Act 2014 and Children and Families Act 2014) to make arrangements for the provision of disability aids and community equipment, to meet the assessed eligible needs of individuals who are resident in their area.
The integrated community equipment contract allows both health and social care professionals to quickly order items for loan such as hoists, beds and commodes for example, which can support early discharge from hospital or prevent the need for a hospital admission in the first instance and enable people to live independently at home. This equipment is specially designed to assist older people and those with longer term conditions to be able to continue to perform core tasks such as washing, getting out of bed, getting up stairs etc, which otherwise might mean that they have to move to a higher need setting or rely on increased care packages. Minor adaptations such as ramps and grab rails also support independence at home.
There is a standard electronic catalogue of equipment available to professionals to order equipment and minor adaptations. Specialist equipment can also be ordered where the client has specific requirements that cannot be met within the standard catalogue.
Where we want to be – Our Vision
Our future vision and direction of travel is to achieve a proactive, personalised and predictive care technology service that uses connected modern technologies and data driven insights as standard to support residents who have a range of care and support needs to live and age well independently and safely in the place they call home. This offers the opportunity to connect to the ‘Internet of Things’. The ‘Internet of Things’ (IoT) refers to the rapidly growing network of connected objects that are able to collect and exchange data in real time over the internet or other communication networks using embedded sensors. Thermostats, cars, lights, refrigerators, and more appliances can all be connected to the IoT. This supports the key principles of personalisation, inclusion, interoperability, privacy and security.
Challenges and Market Influencers
The technology enabled care and community equipment market is a specialist niche market and as such has been characterised by a few dominant providers delivering services, using their own hardware/equipment, delivered either through web-based systems, cloud-based systems or on site/at their premises.
Over the last decade, digital technology has opened up opportunities for others, particularly software solution developers, to enter and disrupt the telecare market by embracing the world of widely available connected smart technologies. This has enabled the installation of sensor-based technology within people’s homes, which collect data and detect vital signs of wellbeing, accessed easily through apps on smart devices.
This has created opportunities within the sector to collaborate and develop systems that allow interoperability making it easier for software solution developers to enter, participate and collaborate.
The telecoms industry infrastructure upgrades of telephony lines from analogue to digital by 2025 requires a shift to digital ready technology solutions to ensure the reliability and safety of our current analogue telecare provision (as recommended by the Office of Communications, commonly known as OFCOM, the Government approved regulatory and competition authority for the broadcasting, telecommunications and postal industries).
Need and Demand
There have been up to 1,100 (this figure fluctuates as clients move in and out of service as their needs change) residents living in their homes across Sutton and 508 residents in the Council’s Independent Living Schemes (ILS) who are in receipt of Sutton’s Telecare Referral to Response service.
Diagram 1 : Number of Service Users (Excluding Independent Living Schemes)
Data Source: Supplier Monthly Monitoring Returns (December 2022)
The bar chart above sets out the number of service users who are living in their own homes, in receipt of a community alarm, telecare services, and/or mobile response in the years 2020- to 2022. The number of service users in receipt of a community alarm was 1025 in 2020, 2110 in 2021, and 1189 in 2022. There were also 870 service users receiving additional telecare services (for example a chair or door exit sensor) in 2020, 1791 in 2021 and 1103 in 2022. For a mobile response service, there were 859 service users in 2020, 1769 in 2021, and 1127 in 2022.
In addition to those individuals living in their own homes, all residents of the 508 dwellings within the ILS have access to the community alarm and mobile response services. For residents within the schemes receiving additional telecare services following an assessment by social care, the numbers were 22 service users in 2020, 45 in 2021, and 25 in the first three quarters of 2022.
Table One : Service Users Per Ward
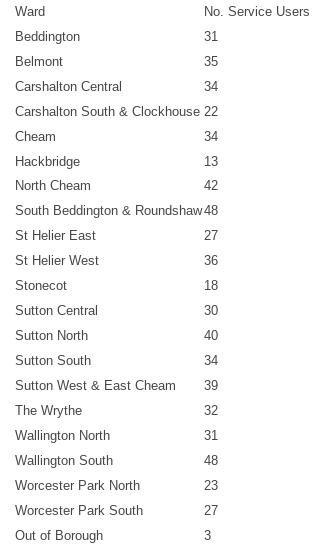
Source: Adult Social Care Sutton
The table above shows the number of residents per ward receiving services. The wards of South Beddington and Roundshaw and Wallington South have the highest number of residents receiving services. The use of TRR has been growing significantly year on year, as social care and health continue to keep pace with expanding demand in order to deliver timely hospital discharges and demand for home-based care. The service is not static and people move in and out of the service as their needs change.
Diagram 2 : Number of Installations, Assessments and Removals 2017 to 2022
Data Source: Supplier Monthly Monitoring Returns
The graph above shows the total number of removals, assessments and installations increasing each year from 2017 to 2022. In 2017 the number of removals was not recorded, however from 2018 to 2022 there was an increase from a total of 136 to 166 (22.06%), the number of assessments increased from 124 in 2017 to 500 (303%), and the number of installations increased from 188 to 564 (200%)
Older people with complex and/or multiple needs aged 65+ make up over 80% of the recipients, which reflects the growing ageing population with such needs. These individuals need a high level of support with many aspects of their daily lives (this may be because of illness, disability, broader life circumstances or a combination of these) and rely on a range of health and social care services. This is presented in the graphs and charts below, which show the number of clients in receipt of the service by age range and primary support reason.
Diagram 3 : Age of Service Users Receiving Telecare Services (Including Independent Living Schemes)
Data Source: Adult Social Care Sutton
The bar chart above shows the age breakdown of all service users in receipt of telecare services, irrespective of housing tenure. Over 80% of recipients are aged 65 or above, with 22.95% aged 65 to 74, 31.5% aged 75 to 84, 24.22% aged 85 to 94, and 3.9% aged 95+. Of those below the age of 65, 13.46% are aged 50 to 64, with just 3.9% aged 26 to 49 and 0.08% aged 18 to 25.
Diagram 4 : Primary Support Reason of Service Users Receiving Telecare Services (Excluding Independent Living Schemes)
Data Source: Adult Social Care Sutton
The pie chart above shows that for 76.2% of recipients, physical support is recorded as their primary support reason.
Diagram 5 : Gender of Service Users Receiving Telecare Services (Including Independent Living Schemes)
Data Source: Adult Social Care Sutton
The pie chart above shows that 61.2% of service users are female, and 38.8% are male.
The Alarm Receiving Centre (ARC) monitors alarms or alerts received from clients 24 hours a day, every day of the year. Information provided during September 2022 from the ARC highlights that of the total number of 6300 alerts received from residents in Sutton, including those in the Council’s Independent Living Schemes, half were due to a combination of false alarms (where a client or carer may have triggered or pressed an alarm in error) and faults (where there are automatic alerts which may be triggered due to a low battery and or where a device may be unplugged in the home).
The two pie charts below show a breakdown of the alarm calls and alerts received.
Diagram 6 : Reasons for Alarm Calls and/or Alerts Activity (Independent Living Schemes)
Data Source: Supplier Monthly Monitoring Returns (September 2022)
The pie chart above shows the breakdown of alarm calls/alerts received by the ARC from residents living in the Independent Living Schemes. The largest proportion of calls/alerts (39.5%) were due to a fault, followed by 10.3% due to a false alarm. A further 19.3% of calls were due to system maintenance and testing. Of the total 7.9% of alerts or calls were triggered by clients and or family/carers seeking information, with emergency calls accounting for 6.9% of all alarm calls/alerts.
Diagram 7 : Reasons for Alarm Calls and/or Alerts Activity (Residents living in their own homes)
Source: Supplier Monthly Monitoring Returns (September 2022)
The pie chart above shows the breakdown or alarm calls/alerts received by the ARC from residents living in their own homes. The largest proportion (30.1%) were false alarms, followed by 19.2% due to a fault. A further 19.7% of calls were due to system maintenance and testing, and 5% due to mains failure. Emergency calls accounted for 10% of all calls/alerts, with ‘incumbent assistance’ at 6.8%, and 5.7% triggered by clients and or family/carers seeking information.
Cessation from the service is most frequently as a result of people moving to residential care or due to their death.
A range of technology enabled care solutions and environmental sensors may be provided to individuals to reduce risk, including wearable alarms, bed/chair occupancy sensors, door contact sensors, temperature/smoke/carbon monoxide detectors, movement sensors, and wrist-worn falls detectors.
Diagram 8 : Top 10 Telecare Support Services and Devices – For all residents living at home and within Independent Living Schemes
Data Source: Supplier Monthly Monitoring Returns (October 022)
The pie chart above shows the top ten telecare support services and devices in place. The Monitoring Service makes up the largest proportion (18.6%), followed by Emergency Mobile Response (13.8%), Keysafe (8.1%), Doro UP GSM Carephone (8%), Tunstall Lifeline VI (6.8%), Tunstall Vibby Falls Detector (6.1%), Doro Vibby Falls (5.2%), Doro Smoke Alarm (3.9%), Tunstall Smoke Detector (3.6%), and Possum Vibby Falls Detector (3.3%). A further 78 services and devices account for the remaining 22.5%.
As an agnostic equipment provider, the incumbent provider will source equipment from a range of manufacturers.
From August 2021, in preparation for the analogue to digital switchover, all new dispersed alarm units installed are now digital ready.
The quantity of community equipment loans and minor adaptations has been steadily rising over time, responding to a greater focus on supporting timely hospital discharges and demand from home-based care for Sutton residents living across the borough.
In 2019/20 there were 3398 service users receiving equipment. In 2020/21 during the COVID-19 pandemic there was a 3% reduction, with 3297 service users receiving equipment. However, from 2021/22 there has been a 8% rise in the numbers of service users receiving equipment.
Diagram 9 : Number of Service Users Receiving Minor Adaptations
Data Source: Supplier Monthly Independent Procurement Hub (IPH) Statement
The bar chart above shows that 1118 service users received minor adaptations in 2019/20, 1405 in 2020/21 and 1567 in 2021/22. In the first three quarters of 2022/23, 1044 service users received minor adaptations
Diagram 10 : Total Number of Equipment and Minor Adaptations Ordered
Data Source: Supplier Monthly Independent Procurement Hub (IPH) Statement
The bar chart above shows that the number of items of equipment ordered over the past three years has increased year on year. In 2019/20, 2020/21 and 2021/22 the total number of items ordered was 20,457, 21,575 and 23,447 respectively. This is an increase of 14.62% since 2019/20.
Table Two : Stock Description
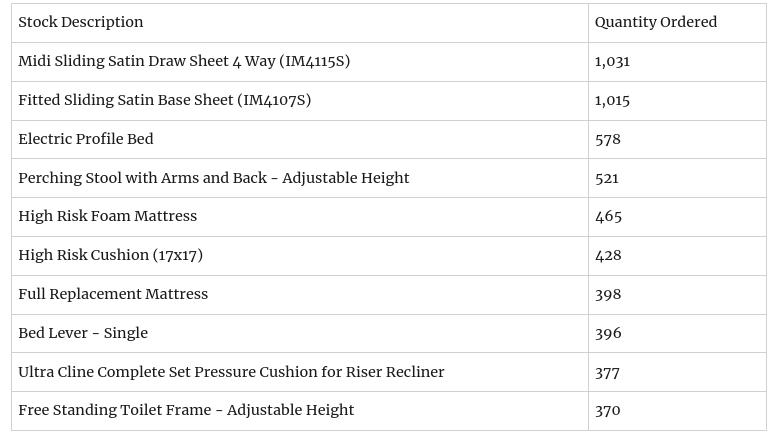
Source: Supplier Monthly IPH Performance Statement
The table above shows the top 10 equipment orders in 2021/2022. The top 10 most ordered equipment in terms of costs and volumes has remained relatively constant over the last three years with profiling beds, hoists, full replacement mattresses and sliding sheets, and perching stools in high demand.
The majority of specialist equipment prescribed and ordered by professionals for clients (adults or children) is mainly for children’s seating. Over the past 3 years spend on specialist equipment has remained relatively constant at just over £300K.
Diagram 11 : Percentage of Equipment Spend Per Age Group
Data Source: Supplier Monthly Independent Procurement Hub (IPH) Statement
The bar chart above shows that over 70% of equipment is prescribed to older people. Spend on equipment prescribed to those aged over 85 has increased over the last three years by over 5% (from 25% in 2020/21 to just under 30% 2023). Under 18s and adults aged 18 to 64 prescribed equipment has remained relatively constant over the last three years at just over 10% and 15% respectively.
Diagram 12 : Percentage of Minor Adaptations Spend Per Age Group
Data Source: Supplier Monthly Independent Procurement Hub (IPH) Statement
The chart above shows that in the year 2021/22, 2.84% of the minor adaptation spend was on those aged 0-17, 16.45% was spent on individuals aged 18 to 64. The largest percentage (48.83%) was spent on individuals aged 65 to 84, with the remaining 31.83% being spent on those aged 85 and over.
Diagram 13 : Percentage of Equipment Spend per Issue Code 2021/2022
Data Source: Supplier Monthly Independent Procurement Hub (IPH) Statement
The majority (approx. 43%) of equipment and/or minor adaptations are issued to enable individuals to retain their independence at home. Nearly a quarter are issued to support a hospital discharge and just under 20% issued to prevent a hospital admission. This is shown in the pie chart above.
A key requirement of this service is sustainability through the provision of energy efficient devices, recycling and reusing of equipment and devices which are on loan to service users. To achieve this, when service users needs change or they no longer require the service, the equipment is returned, decontaminated and reissued to another service user. As a result the provider only procures new devices where equipment is not available or specialist/complex technology is required.
Collection of equipment that is no longer needed by clients have been steadily rising over the last three years.
Diagram 14 : Total Number of Items of Equipment Collected
Data Source: Supplier Monthly Independent Procurement Hub (IPH) Statement
The bar chart above shows that in 2019/20, 8591 items of equipment were collected. In 2020/21, this number rose to 10,324, rising again to 10,925 in 2021/22. The number of items collected in the first three quarters of 2022/23 was 10,059.
Diagram 15 : Recycling Rates
Data Source: Supplier Monthly Independent Procurement Hub (IPH) Statement
The bar chart above shows that the recycling rates on average have remained relatively constant over the last three years (2019 to 2023) at just under 80%.
How we need the market to develop for the future
Sutton has long held a reputation for being an innovative and forward thinking Council. Over the past three years, we have been at the forefront of testing and piloting care technology initiatives at both a local level and as part of the South London Partnership Innovate Programme.
The pilots have identified the following areas of improvement and gaps in service provision:
- The Referral to Response Service is reactive and relies on someone calling for help rather than proactively responding
- Review our digital telecare and technology enabled care service to respond to new innovations
- Monitoring of activities of daily living should be offered as standard rather than as a separate solution
- Data visualisation should be included as standard in any future telecare contract to enable appropriate individualised care packages and to pick up early signs of decline
- Place greater focus on an outcome driven approach
- The technology must work across Health, Housing and Social Care systems
Commissioning Sutton’s New Technology Enabled Care Services
Sutton is in the process of commissioning a new service to address the improvements and gaps identified and to ensure that the crucial change from analogue to digital across social care and the Council’s Independent Living Schemes is achieved.